Application profiling
In case the application performs poorly when serving a request, profiling can help to spot the areas in the code that need improving. This guide explains how to start the application in a way that profiling tools are run. It currently focuses on the backend especially on using flamegraph.
Adding thin to the gemfile
The default web server OpenProject runs on is puma, which is threaded. The profiling tool used is rack-mini-profiler which makes use of i.e. stackprof. Those tools cannot work in a threaded environment which is why thin needs to be employed. This is achieved by adding
gem 'thin'
to the Gemfile or Gemfile.local in case the later already exists.
If profiling is a recurring task, it might also make sense to add another gemfile, e.g. Gemfile.profiling and use the environment variable CUSTOM_PLUGIN_GEMFILE to have OpenProject load it.
Then run bundle install or CUSTOM_PLUGIN_GEMFILE=Gemfile.profiling bundle install to install thin.
Starting the application
Since thin is to be used, and the profiling gems are to be loaded, the application needs to be started like this:
OPENPROJECT_RACK_PROFILER_ENABLED=true thin start
or, if a custom gemfile includes the reference to thin, use the following:
CUSTOM_PLUGIN_GEMFILE=gemfile.profiling OPENPROJECT_RACK_PROFILER_ENABLED=true thin start
This will start the application in development mode, which oftentimes is sufficient, but will lead to slightly distorted results since reloading and reloading checks, especially the ones for I18n, will take place.
To avoid this, the application can be started in production mode but before this can happen, the code needs to be adapted slightly:
- Search for the places where
OPENPROJECT_RACK_PROFILER_ENABLEDis referenced within the code and remove the references toRails.env.development?from the conditions. At the time of writing, this needs to be done at:config/initializers/rack_profiler.rbconfig/initializers/secure_headers.rb
- Read the profiling gems to your
Gemfile/Gemfile.local/Gemfile.profilingsince they would otherwise only be available in the development environment:
gem 'flamegraph'
gem 'rack-mini-profiler'
gem 'ruby-prof'
gem 'stackprof'
Start thin via:
SECRET_KEY_BASE="$(openssl rand -hex 64)" RAILS_ENV=production CUSTOM_PLUGIN_GEMFILE=gemfile.profiling OPENPROJECT_RACK_PROFILER_ENABLED=true thin start
Using the profiling tools
Profiling now takes place on every request and every request will be slowed down by it which is why you should not profile on an actual production setup.
Having a flamegraph displayed is triggered by issuing the request with pp=flamegraph as a query prop. E.g. requesting
http://localhost:3000/api/v3/work_packages?pp=flamegraph
will show the flamegraph for that api request.
The options available can be displayed by adding pp=help to a query.
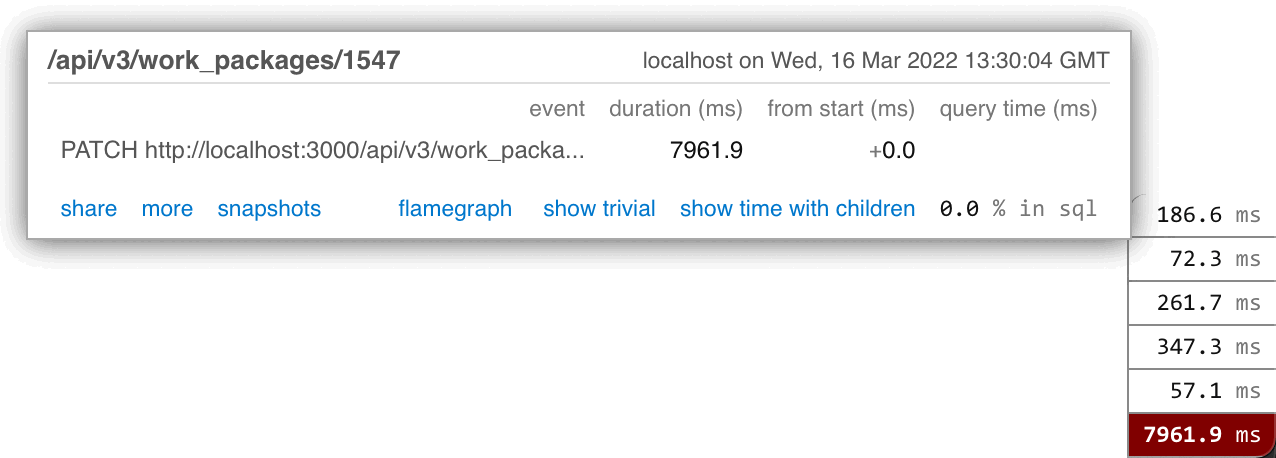
API patch/post requests
For bodied requests (e.g. patch/post) which typically are triggered not from a browser when profiling, a flamegraph can still be created, e.g.:
PATCH http://localhost:3000/api/v3/work_packages/1547?pp=async-flamegraph
will result in a flamegraph being created. Instead of appending pp=flamegraph, the appended parameter needs to be pp=async-flamegraph.
But that flamegraph will not show up directly in the tools typically used.
The flamegraph needs to be accessed by calling an arbitrary page of the application via the browser after having issued the bodied request (e.g. http://localhost:3000). In the lower right corner, sometimes after some waiting, the profiling tools will show a small menu from which the generated flamegraph can be accessed.
In case this fails, the flamegraphs are stored in tmp/miniprofiler in a file called mp_timers_[some hash]. Knowing which file belongs to the previously created flamegraph, the file can be opened by requesting:
http://localhost:3000/mini-profiler-resources/flamegraph?id=[some hash]