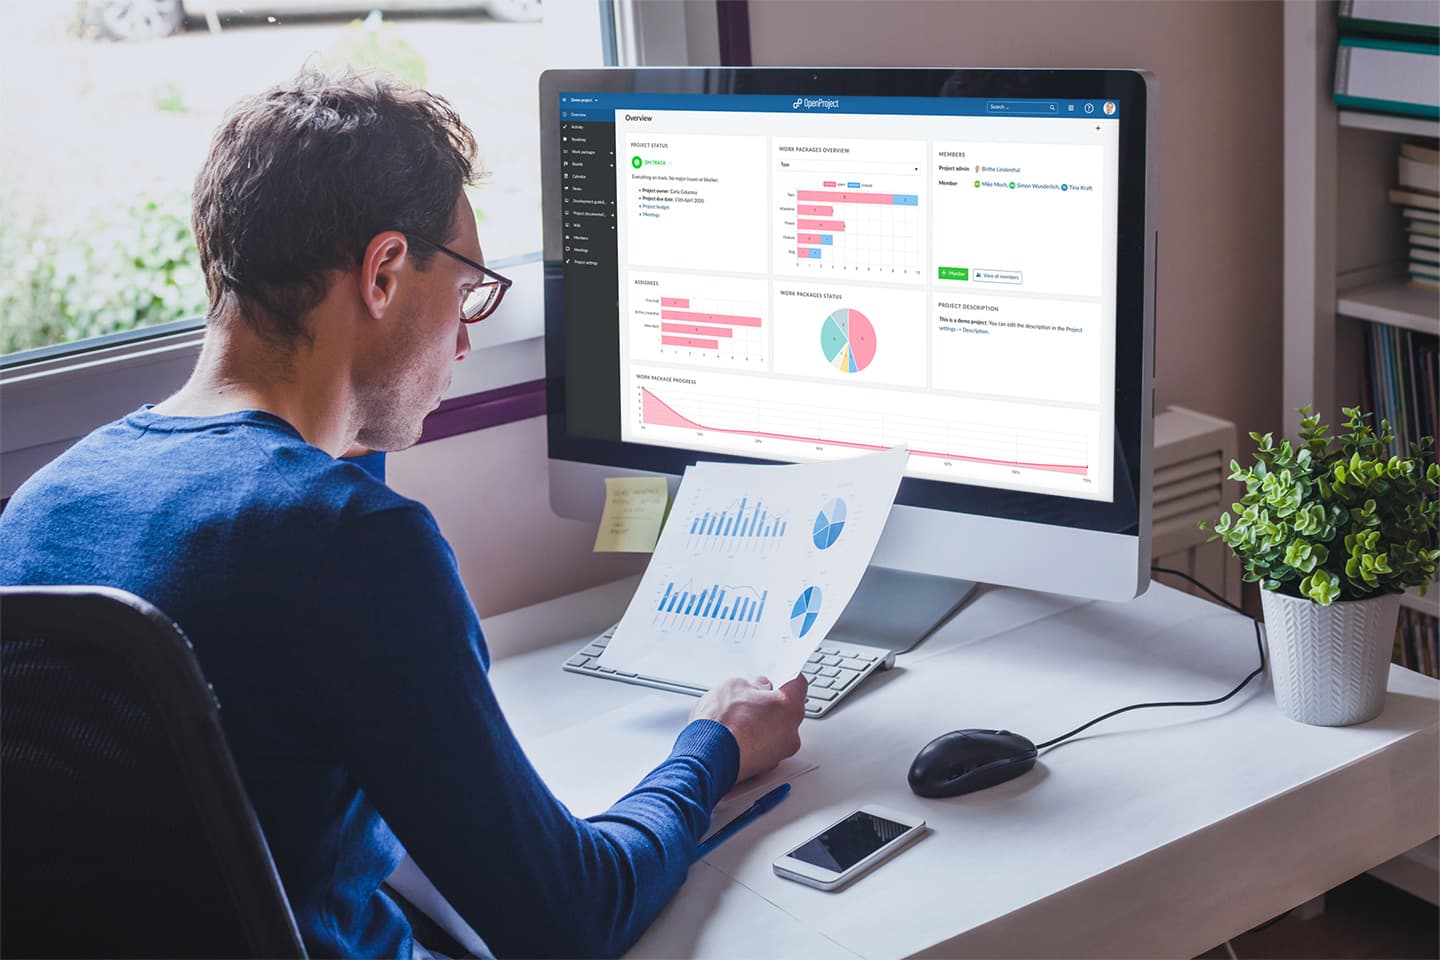
Reporting your project status made easy
One of the most important aspects in project management is reporting. A project report shows the current status of the project at a given time. It is usually done on a regular basis, e.g. weekly or monthly. The project report serves the purpose to keep all stakeholders up to date regarding the project progress, to make challenges for the team apparent and to be able to make decisions for next steps. However, many project managers complain about reporting of projects because they need to gather information from various project members and then manually compile it into a report. This can take quite a lot of time and effort.
A web-based project management software like OpenProject offers a central platform that hosts all project relevant information. Project members have access to all information at any time from anywhere. For example, instead of saving documents on a drive, the team can use the Wiki as a knowledge base or attach relevant documents directly to work packages. No more Excel files for planning or budgets as it is done in OpenProject. Plenty of other features enable the project team to have all project related information in one place.
Because OpenProject is the single source of information, it spares you from tedious project reporting. You can pull all information for your report from OpenProject and format it according to your requirements.
Using the OpenProject dashboard
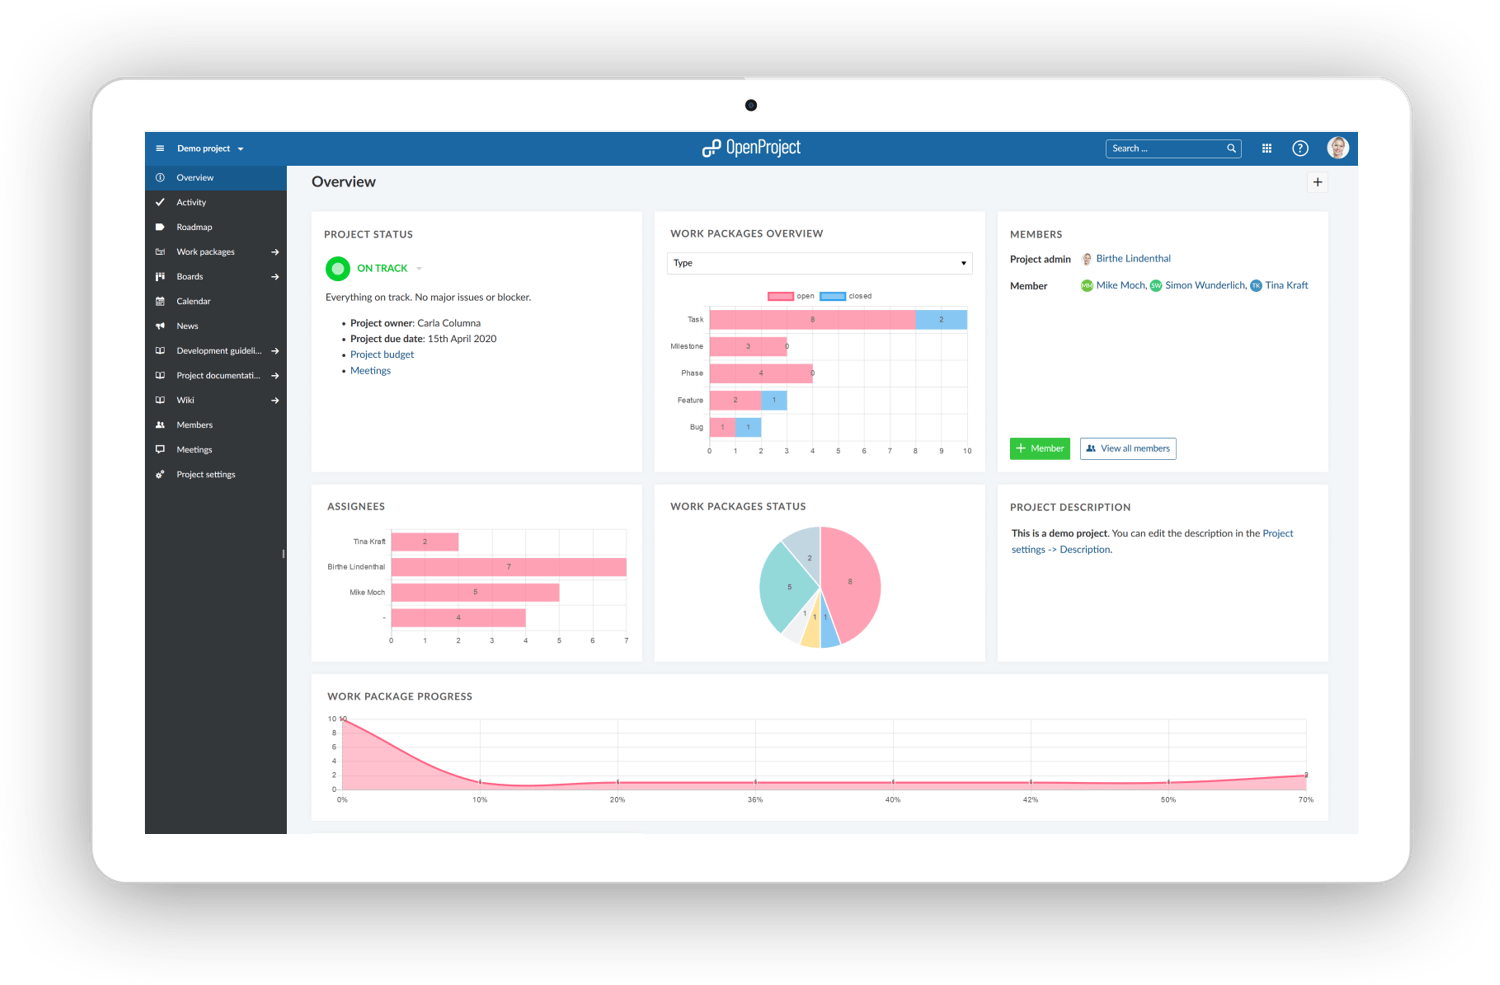
OpenProject provides you with the project overview page that serves as a dashboard. Eine Vielzahl von flexiblen Widgets ermöglicht es Ihnen, den Projektstatus anzuzeigen und weitere wichtige Projektinformationen auszutauschen. Configure your project overview page with important information that you need to report to your stakeholders. Of course, it is not only for the stakeholders but also supports you in being up to date and knowing if there is a need to readjust, make changes to the plan or support certain project members.
The project overview page includes a variety of flexible reporting widgets to show the project status and share progress with your team and other stakeholders. Keep an eye on work package status, assignees, progress, priorities, displayed within graphs on the Overview page. Links to work packages and other pages help you to navigate easily within the project and gather more detailed information if needed.
Available widgets
Beyond the widgets that you can see in the above example, this is the comprehensive list of widgets that you can use to create your own project dashboard:
- Kalender
- Benutzerdefinierter Text
- Mitglieder
- Nachrichten
- Projektbeschreibung
- Projektdetails
- Projekt-Status
- Verbuchte Zeit (letzte 7 Tage)
- Unterprojekte
- Arbeitspaket-Graph
- Arbeitspaket-Übersicht
- Arbeitspaket-Tabelle
Especially the work package widgets provide you with a great visual status overview so that you see at one glance where your project is standing. In order to give you a better understanding of the widgets that are not as self-explaining, we prepared some examples for you. The full description of all widgets and how to set them up can be found here.
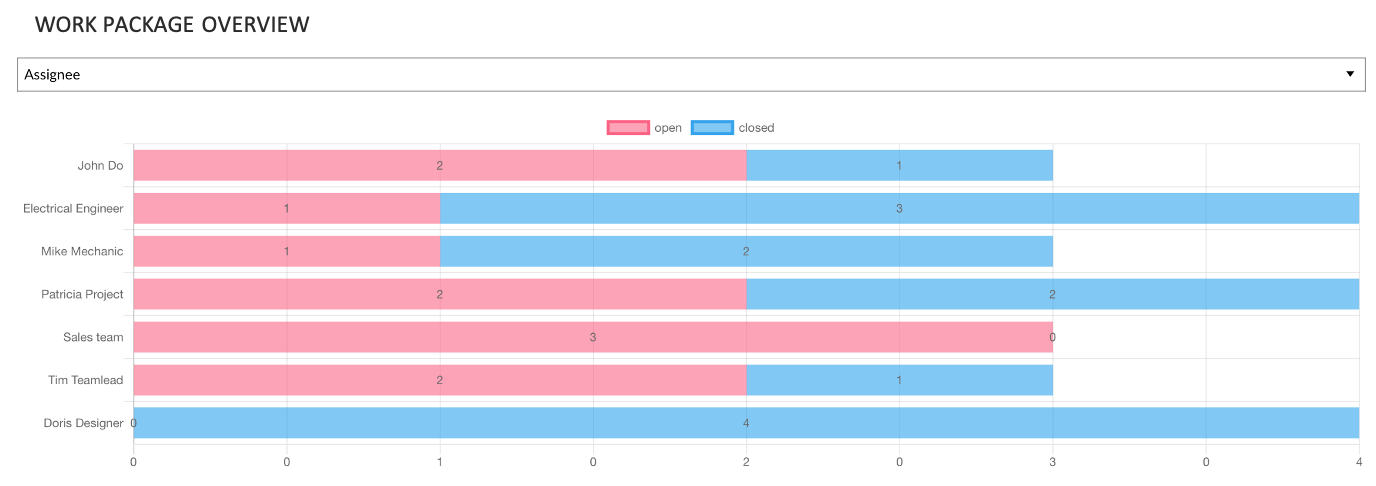
Arbeitspaket-Übersicht
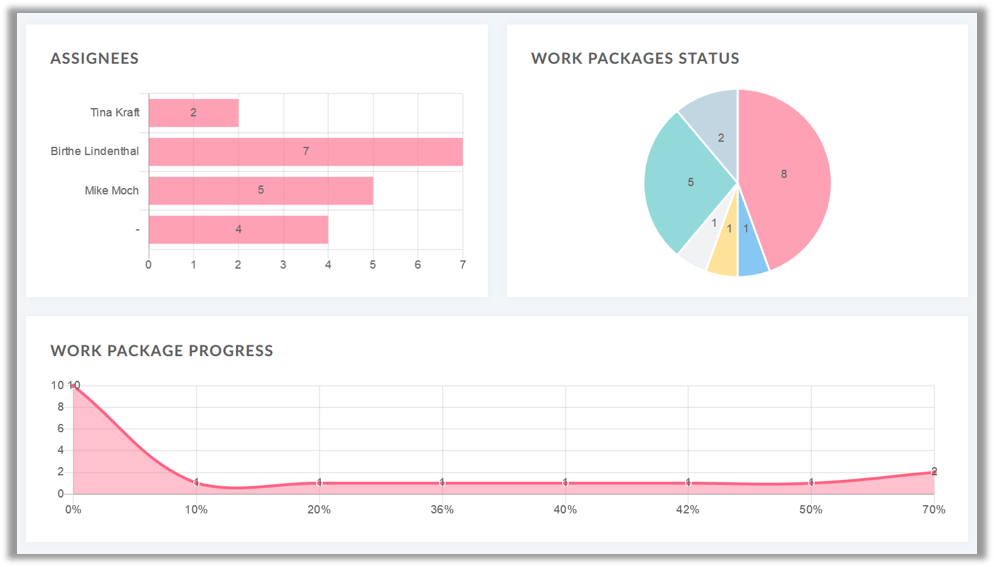
Display a work packages overview of your project. Choose between the following grouping options: Type, Category, Status, Author, Priority, Assignee. The below example shows the work packages by assignee so that the project manager could check who of the project members still has a lot of work to do.
Arbeitspaket-Tabelle
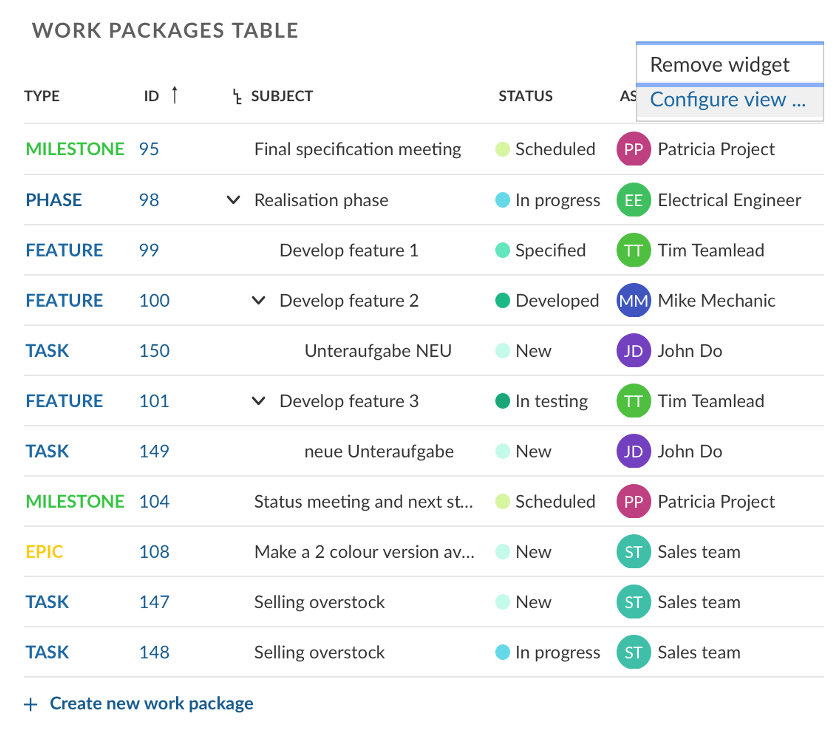
Add the work package table and filter the work packages you would want to see: e.g. only open work packages, all closed work packages, work packages of a certain assignee or milestones only etc. You have a lot of options.
Arbeitspaket-Graph
You can show your work packages also in graph format. Choose between bar, doughnut, pie, line, polar area, radar graph to see at a glance which person has the most work packages assigned, how many work packages have been done, how many work packages with high priority are still open etc.
Aufgewendete Zeit
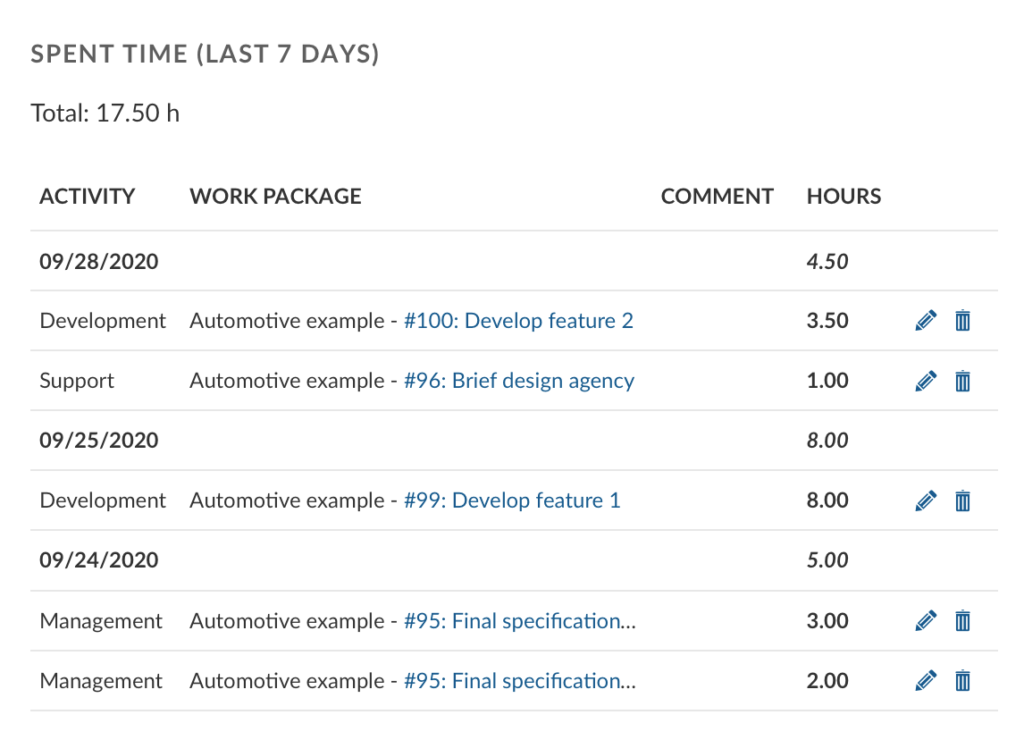
On your project overview page you can also see who has spent how much time on which work package in the last week. This allows you to get an understanding of the progress of your project by checking which work packages have been worked on and to also roughly check whether your time estimation was right.
Projektportfolio
You might be managing more than one project and thus also need an overview over your project portfolio to check the status and report to your stakeholders. The configuration of the “view all projects” page now enables better project portfolio management. You can configure the “view all projects” list to show relevant project information for all projects, e.g. add custom fields for projects and remove columns which are not needed. With the link to the Gantt charts view you can directly open a global work packages view for all projects, configured to your needs, e.g. to show all milestones across all projects.

